

In today’s era, enterprise-level industries are inherently striving to improve the delivery and efficiency of marketing campaigns. Generating sales and revenue is an essential part of marketing strategies, and hence it is crucial to analyze how your digital marketing techniques are performing.
Fortunately, marketers can connect Facebook Ads to Google Data Studio and visualize the performance of their marketing campaigns. The tool allows users to create reports with data sliced and diced in numerous ways, providing enhanced insights into data performance. An optimized dashboard can help raise the bar and elevate your reporting level exceptionally.
A Quick Glance on Google Data Studio
Google Data Studio is a free tool released by Google on June 2, 2016. The platform allows users to connect numerous data sources for analyzing performance metrics. It helps define custom dimensions and calculations to be viewed by marketers within multiple dashboards.
The tool is highly flexible and enables users to add google sheets as a data source, removing hurdles of integrating non-Google products. Companies can easily use the platform to connect Facebook Ads to Google Data Studio to gain insight into how their marketing initiatives are performing and if they are investing their budgets in the right direction.
The Significance of Connecting Facebook Ads to Google Data Studio?
If utilized properly, Facebook Ads are a highly valuable resource as they tell you a lot about your audience and customers. The data helps monitor where your marketing campaigns are doing good and the areas you need to focus on.
Integrating Facebook Ads into Google Data Studio helps users maintain reports that can be shared with clients, officials, and managers for further analysis. Some of the benefits of connecting Facebook Ads to Google Data Studio are below:
Customisable Templates
Google Data Studio has a unique feature where users can create marketing templates from scratch that can be easily selected and configured based on their requirements. These customizable templates allow users to showcase their Facebook Ads data and make well-informed decisions.
The dynamic reports also provide users with the flexibility to change the range of time for Facebook Ads. This feature helps them select the interval of data they wish to see on the dashboards, thus simplifying data analysis.
Clear Report Visualization
The platform offers users numerous tools for visualizing Facebook Ads for understanding data points and generating valuable insights. It comes with specialized data viewing charts like heat graphs, time series, maps, and tables that companies select depending on business requirements.
Google Data Studio also allows users to add scorecards and dashboards. These boards enable them to add different KPIs and extract real-time aggregated information. The platform also allows users to blend data from other sources into the same chart or table.
Shareable Reports
Reports generated by Google Data Studio can be shared with other clients, team members, company managers, and higher officials. The platform allows these to be converted into PDFs and shareable links and passed into groups where multiple people can access them for analysis.
Step-by-Step Guide on Integrating Facebook Ads with Google Data Studio
Currently, Google does not have built-in integration for uploading data sets into Google Data Studio. Hence, a static data source in a CSV file is used to pull in Facebook Ads data. This upload feature also lets you report on data not supported by a specific connector.
Some of the prerequisites of connecting Facebook Ads to Data Studio are below:
- Access to the internet and a web browser.
- A Google account and a Facebook Ads account.
- Some prior knowledge about Google Apps and Facebook API.
Now, let’s explore the steps on how to create your static data set file from Facebook Ads and ultimately uploading that file into Google Data Studio for analysis:
Step 1 – Exporting Facebook Ads Report as a CSV file
Users have the option of selecting specific campaigns, columns, and Ad sets that they want to export as a CSV file. The steps are below:
- Go to your Facebook Ads Manager page.
- Click on Reports.
- Select Export table data from the drop-down menu that pops up.
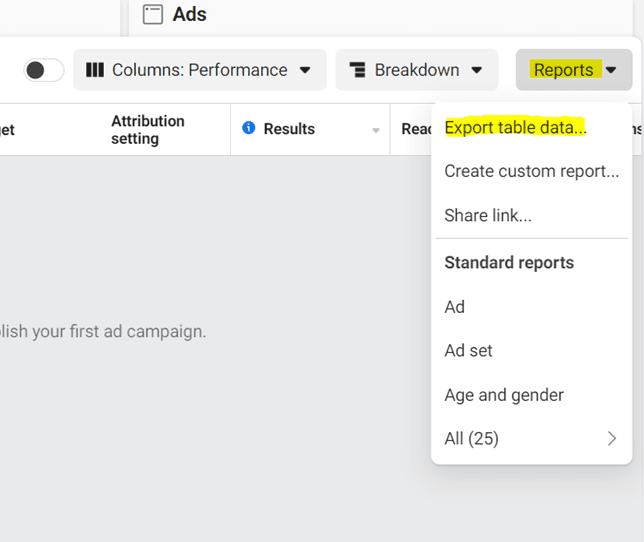
- Choose Export as .csv and then click on Export.
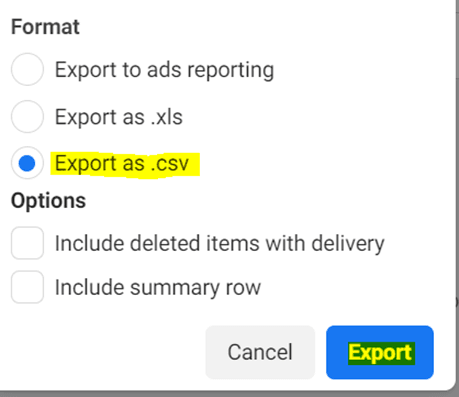
- You may see a pop-up window where you will be asked to select Export all or specific campaigns, Ad sets or Ads as a CSV file.
- You will see an excel file with datasets in your Downloads folder. This is the CSV file that you will upload in Google Data Studio for viewing your Facebook Ad campaigns.
Step 2 – Creating a Data Set in Data Studio
A data set is a collection of files with the same data structure. Once a file upload data set is created, you can easily integrate it with data sources that utilize that data file. Steps on how to create a data set are below:
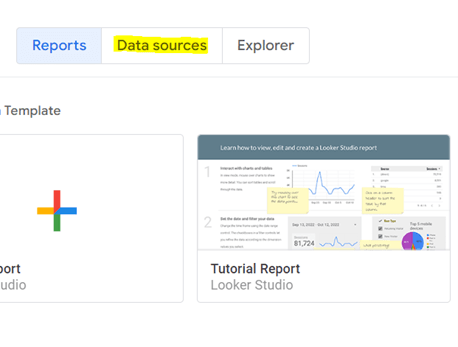
- Go to Google Data Studio and sign in your Google account.
- In the window that opens after signing in, click on Data sources.
- Next, click on Create and select Data source.
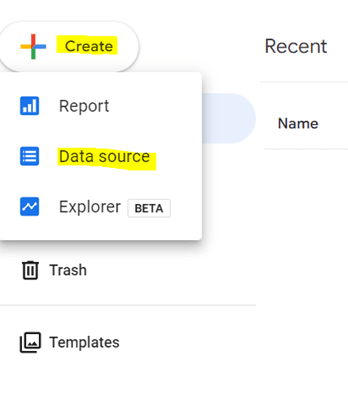
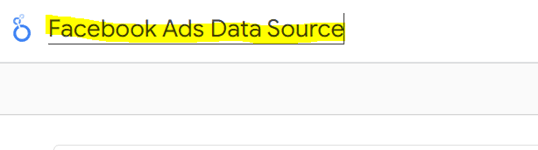
- In the window that opens, give your file a meaningful name like Facebook Ads Data Source.
Step 3 – Uploading the CSV file to Google Data Studio
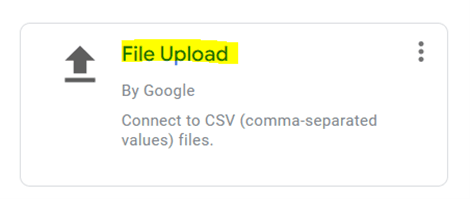
- In the Connectors panel window that opens, select File Upload from the connectors built by Data Studio. This connector enables users to connect the Data Studio account with a CSV file.
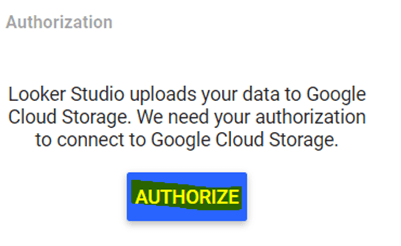
- Click on Authorize to upload your data to Google Cloud Storage.
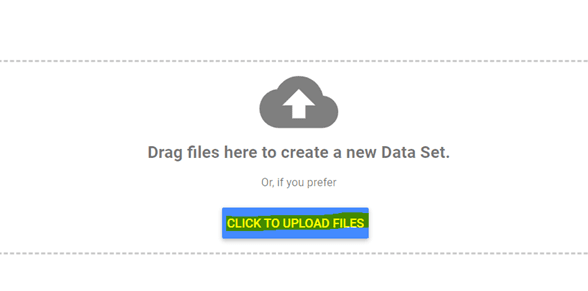
- Click on CLICK TO UPLOAD fILES. If you prefer the drag and drop method then you can also use it to select more files from your computer to the upload target.
- Select the CSV file that you created from your Downloads and it will be added to the data set.
What are the Key Features of Google Data Studio?
Google Data Studio comes with numerous robust features that make it a go-to solution for marketers to visualize data reports. Some of its main features are below:
Access to interactive elements
One of the most prominent features of Data Studio is its interactive dashboard that uplifts your marketing reports to a whole new level. The features enable users to view data using various filters. The dashboard consists of buttons, drop-down menus, and clickable links, making the reports more interactive.
Varying chart types for displaying data sets
The platform allows users to visualize data using different charts, making it easier to see the performance of their marketing campaigns. The tool facilitates tables, time series, scorecards, treemaps, Google Maps, pivot tables, and line/bar graphs to visualize your data.
For instance, if you have CRM data on Google Sheets, you can use different charts in the studio to view your data. If you are an SEO specialist, you can use charts to showcase your content’s performance instead of using boring screenshots.
Teams collaborating in real-time
Data Studio allows users to interact in real time like every other Google tool. If you need to create a marketing report for an offline site, you can grant access to the market activation manager of your report dashboard to input data in real time. This helps create accurate marketing reports as you can instantly comment and get feedback on changes occurring at the current time.
Capability to blend data and connect to numerous data sources
Data Studio stands out from the conventional reporting tools since it can blend numerous data sources. If you need to calculate your total ad conversion rate spent on platforms like LinkedIn, Facebook, Instagram, TikTok, and Google, you can utilize this feature to blend the data and view the results.
Marketers use multiple platforms for marketing campaigns. Hence, when creating reports, they have more than one data source. In the past, connecting numerous data sources to gain insight into marketing campaigns was impossible.
With Google Data Studio, you can easily connect multiple sources to create reports by clicking on the “connect data sources” tab in the studio. This will direct you to the connector page, where you can choose from numerous connectors from Google to Portermetrics.
7 Preferred Charts for Analyzing Facebook Ads Behaviour
Now that you have the fundamental knowledge of connecting Facebook Ads to Google Data Studio, let’s explore the different charts you can create for analyzing your marketing campaigns:
1. Assessing the Overall Performance of Your Facebook Account
To get a holistic view of your account data, create a table with high-level metrics, including campaigns with multiple objectives. This table is similar to the Facebook Ads Manager table and allows you to examine the overall performance for a specified date range.
Chart Settings
- Data source: Facebook Ads
- Chart Type: Table
- Dimension: Name of campaign
- Indicator: Clicks, post engagements, CPM
- Selection: “Show summary row”
- Reporting period: Applicable for analysis
2. Using Heatmaps to Measure Campaign Performance
Although quite similar to the overall performance data chart, heatmaps help visually categorize data using color. You can use this table to compare campaigns with the same objectives and ad set performance within a specific campaign.
Chart Settings
- Data source: Facebook Ads
- Chart Type: Heatmap table
- Dimension: Ad set
- Indicator: Website purchases, ROAS, CPM
- Selection: “Show summary row”
- Reporting period: Applicable for analysis
3. Tracking Campaign Results using Demographic Analysis
Bar charts help determine the ages and genders driving most results from your campaigns. These help see where to allocate the Facebook Ads budget by reporting leads and purchases.
Chart Settings
- Data source: Facebook Ads
- Chart Type: Bar chart
- Dimension: Age/Gender
- Indicator: Website leads
- Selection: “Stacked bars”
- Reporting period: Applicable for analysis
4. Analyzing Platform Performance using Cost-per-Result Breakdown
Horizontal bar charts show results and cost per result for each campaign metric. If you’re using automatic placements for campaigns across platforms like Facebook, Instagram, and Messenger, these graphs help see the driving results and their cost.
Chart Settings
- Data source: Facebook Ads
- Chart Type: Horizontal bar
- Dimension: Publisher platform
- Indicator: Website leads and cost per website lead
- Selection: “Show data labels”
- Reporting period: Applicable for analysis
5. Revealing Cost Per Result Trends
Create a bar chart showing results per month over extended periods. You can use these to analyze performance over a quarter, month, or year, depending on the data type you wish to see.
Chart Settings
- Data source: Facebook Ads
- Chart Type: Vertical bar
- Dimension: Year and month
- Indicator: Website leads
- Selection: “Show data labels:
- Reporting period: Applicable for analysis
6. Displaying Website Engagement from Facebook Traffic
Build a chart using Google Analytics and display your campaign traffic. These help determine and evaluate the quality of traffic from your campaigns by analyzing metrics like average session duration and average time on page.
Chart Settings
- Data source: Google Analytics
- Chart Type: Table with bars
- Dimension: Campaign
- Indicator: Average session duration
- Selection: “Show number” for each metric
- Reporting period: Applicable for analysis
7. Compiling Cumulative Data on a Yearly Basis
These show comparison charts across the years. These help oversee how you are pacing throughout the year compared to last year’s data. These are cumulative graphs that help compare results yearly.
Chart Settings
- Data source: Google Analytics or Facebook Ads
- Chart Type: Time series
- Dimension: Date
- Indicator: Session/metrics
- Selection: “Cumulative”
- Reporting period: Current year compared to previous year
What are some of the Limitations?
Like every other tool, this method also comes with the following set of limitations:
- A total of 2GB of your Facebook Ads data is allowed for uploading to Data Studio.
- The uploads on Data Studio have a limit of 100 per day.
- The maximum size of a CSV file is 100MB.
- Adding a data set to an existing data appends it rather than merging it. For instance, if you upload duplicate records, both will appear in your data.
- The files you upload must have the same structure.
Final Thoughts
As a marketer, leveraging free and low-cost tools helps create a seamless reporting experience. Using these tools creates balance in the workplace by shifting your focus on more significant tasks at hand. Therefore, companies should invest in solutions that help connect Facebook Ads to Google Data Studio for analyzing advertising campaigns and ensuring that their time and efforts are driven in the right direction.